News
2021 Press releases
P&F Industries, Inc.
Joseph A. Molino, Jr.
Chief Operating Officer
631-694-9800
www.pfina.com
Joseph A. Molino, Jr.
Chief Operating Officer
631-694-9800
www.pfina.com
P&F INDUSTRIES, INC. REPORTS RESULTS FOR THE THREE AND SIX-MONTH PERIODS ENDED JUNE 30, 2021
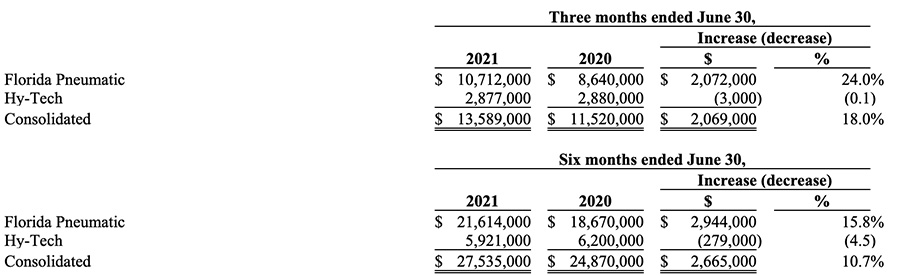
MELVILLE, N.Y., August 12, 2021 - P&F Industries, Inc. (NASDAQ: PFIN) today announced its results from operations for the three and six-month periods ended June 30, 2021. The Company is reporting net revenue of $13,589,000, and $27,535,000, respectively, for the three and six-month periods ended June 30, 2021, compared to $11,520,000 and $24,870,000, respectively, for the same periods in 2020. For the three and six-month periods ended June 30, 2021, the Company is reporting net income before income taxes of $2,334,000, and $1,957,000, respectively, compared to net losses before income taxes of $3,195,000 and $4,458,000, respectively, for the same periods a year ago. Further, for the three-and six-month periods ended June 30, 2021, the Company is reporting net income after-taxes of $2,423,000 and $2,116,000, respectively, compared to net loss after-taxes of $2,381,000 and $3,139,000, respectively, for the three and six-month periods ended June 30, 2020. The income before income taxes for the three and six-months ended June 30, 2021, included the recognition of the forgiveness of a $2,929,200 Payroll Protection Program loan. The Company’s basic and diluted earnings per share for the three-month period ended June 30, 2021, was $0.76. For the six-month period ended June 30, 2021, its basic and diluted earnings per share were $0.67 and $0.66, respectively, compared to basic and diluted loss per share of $0.76 and $1.00, respectively, for the same periods in 2020.
Richard Horowitz, the Company’s Chairman of the Board, Chief Executive Officer and President commented, “We believe we have begun to exit the harsh grips of the COVID-19 global pandemic during the latter portion of the second quarter of 2021, as evidenced by improved performances of several lines of business. The 18.0% increase in our consolidated second quarter 2021 revenue, compared to the same period a year ago, was driven primarily by improved results at our Florida Pneumatic subsidiary, which recorded a 31.6% increase in its Retail revenue, and a 29.2% increase in its Automotive sales. However, its aerospace product line was down 10.3% this quarter, compared to the same period in 2020, as recovery from the impact of the global pandemic at its primary customers and this market segment in general, remain sluggish. Revenue at Hy-Tech this quarter was essentially flat to the prior year. Consolidated gross margin for the three-month period ended June 30, 2021, improved 9.2 percentage points over the same period in 2020. This was driven primarily by higher gross margin at Hy-Tech, which was mostly due to improved manufacturing overhead and the non-recurrence of adjustments to its inventory that were recorded during the second quarter of 2020.
Our second quarter 2021 SG&A expenses increased compared to the same period a year ago, driven by higher variable expenses related to the increase in revenue, higher total compensation costs, and costs related to the May 2021 ransomware attack at our Florida Pneumatic subsidiary. The above increases were partially offset by reductions in our professional fees, general corporate expenses and depreciation and amortization expenses.”
Mr. Horowitz added, “In June 2021, our PPP loan was forgiven, thus allowing us to record a non-taxable $2.9 million gain, which was accounted for as other income this quarter.”
Mr. Horowitz concluded, “While we are happy with the improved results over the prior year, we are excited for what we believe are still better days ahead and remain cautiously optimistic about future growth. However, for now, COVID-19 remains an issue, as cases have once again risen in many parts of the country and abroad. We intend to do our utmost to continue to serve our customers, while ensuring the health and safety of our employees. Through persistence by all of our employees, as well as the loyalty of our customers, we made it through difficult times, and firmly believe that when this pandemic truly is contained, we will be well positioned for future growth.”
The Company will be reporting the following:
TRENDS AND UNCERTAINTIES
COVID-19 PANDEMIC
On March 11, 2020, the World Health Organization designated the recent novel coronavirus, or COVID-19, as a global pandemic. COVID-19 was first detected in Wuhan City, Hubei Province, China and continued to spread, significantly impacting various markets around the world, including the United States. Various policies and initiatives have been implemented to reduce the global transmission of COVID-19.
The COVID-19 virus and the resultant global economic down-turn continues to have a negative impact on our three and six-month 2021 results. There are delays in receiving containers from Asia due to a significant increase in international shipping traffic, which has caused intermittent shortages of inventory. Further, the costs of international freight has greatly increased. In addition, the COVID-19 pandemic has caused many of our customers and potential customers to refuse on-site visits, which is critical to generating revenue. We believe that until this practice subsides, our business could be adversely affected.
BOEING/AEROSPACE
The Federal Aviation Administration (“FAA”) and the European Union Aviation Safety Agency (“EASA”) have lifted the grounding of the 737 MAX. However, production is still very limited due to the inventory at Boeing and the reluctance of airlines to accept deliveries due to weak air travel demand. This will likely continue to have an adverse effect on our revenue. In addition, production of military and other commercial aircraft throughout the industry has slowed as well, we believe due to the ongoing global COVID-19 pandemic. However, we believe when all other commercial and military production lines throughout the United States come back online, an increase in our revenue should follow.
OIL AND GAS
The profitability of crude oil production generally declines when prices fall. As a result, as prices dropped in 2020, production slowed worldwide. However, the price of crude oil has begun to improve. As such, orders and activity during this quarter have begun to strengthen. In addition to the price of crude oil we monitor the number of active rotary rigs, which is discussed elsewhere. Until crude price and rig counts return to pre-pandemic levels, it is likely we could continue to be negatively impacted.
TECHNOLOGIES
We believe that over time, several newer technologies, and features will have a greater impact on the market for our traditional pneumatic tool offerings. The impact of this evolution has been felt initially by the advent of advanced cordless operated hand tools in the automotive aftermarket. For certain non-automotive applications, we have begun to develop cordless models of tools and expect to introduce these products in the near future.
OTHER MATTERS
On May 13, 2021, Florida Pneumatic detected a ransomware attack on its information technology systems that caused data to be encrypted. The threat actor demanded a ransom payment for the release of a decryption key. Florida Pneumatic promptly launched an investigation and notified law enforcement, and legal counsel, who in turn engaged independent third-party incident response professionals to assist in, among other areas, determining the extent of this cyber incident, remediation and restoration. Additionally, Florida Pneumatic implemented a series of containment measures. At the present time, all critical Florida Pneumatic information technology systems have been remediated and, as a result, are operational. We believe that our corporate office and our other subsidiaries, all of which operate on separate, independent networks, were not affected by this incident.
Other than the aforementioned, or matters that may be discussed below, there are no major trends or uncertainties that had, or we could have reasonably expected to have a material impact on our revenue, nor was there any unusual or infrequent event, transaction or any significant economic change that materially affected our results of operations.
REVENUE
During the second quarter of 2021, many of our product lines were still affected to some degree by the global COVID-19 pandemic, which caused our orders and revenue for the three-month period ended June 30, 2021, to be less than pre-pandemic levels.
The tables below provide an analysis of our net revenue for the three and six-month periods ended June 30, 2021, and 2020:
Consolidated
Florida Pneumatic
Florida Pneumatic markets its air tool products to four primary sectors within the pneumatic tool market; Automotive, Retail, Aerospace and Industrial. It also generates revenue from its Berkley products line, as well as a line of air filters and other OEM parts (“Other”).
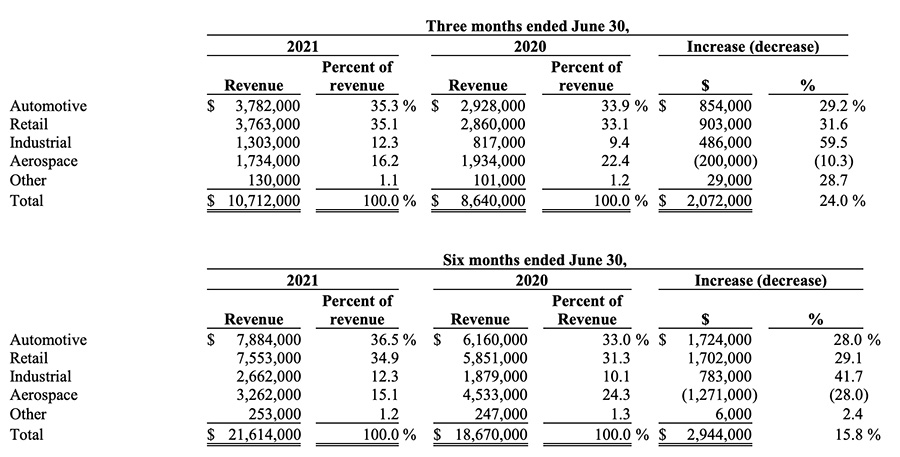
Although much of U.S. and global economies were still suppressed due to the global COVID-19 pandemic during the second quarter of 2021, all of Florida Pneumatic’s lines of business, other than aerospace, are reporting improvements. As a result, Florida Pneumatic’s second quarter 2021 total revenue increased $2,072,000, or 24%, compared to the same period in 2020. Of note, driven by among other things, increased demand for various “spray gun” tools and accessories, which we believe is being driven by the ongoing battle to disinfect and sanitize homes and businesses alike, and other “Do-It-Yourself”, or DIY pneumatic hand tools, its Retail revenue increased 31.6%, quarter over quarter. Additionally, stronger consumer demand for its AIRCAT products and, to a lesser degree, modest increased sales at our United Kingdom (“U.K.”) operations, were the primary factors for the increase in Automotive revenue. Further, Florida Pneumatic’s second quarter 2021 Industrial revenue improved 59.5% over the same period a year ago. This increase, we believe is due in part to certain sectors beginning to recover from the ill effects of the pandemic. However, its second quarter 2021 Aerospace revenue declined 10.3%, compared to the same period in 2020. The Boeing Corporation is a major customer of Jiffy. The Boeing 737 MAX aircraft was grounded by the FAA and the EASA in March 2019. Although both agencies have lifted the “No Fly” ruling it imposed on all Boeing 737 MAX aircraft, allowing it to begin flights in the United States, and Europe, we believe it will take several years for the Boeing Corporation to increase its manufacturing of its 737 MAX aircraft to a volume that would be comparable to pre COVID-19 levels, and thus require a material amount of our Jiffy tools. Lastly, orders from other aerospace companies and military aircraft manufacturers declined, we believe, due to COVID-19 constraints placed on manufacturing facilities.
An analysis of Florida Pneumatic’s six-month revenue is fairly consistent with its second quarter 2021 results discussed above. Specifically, its Automotive revenue, driven by growing demand for its AIRCAT line of pneumatic hand tools, plus stronger sales generated by its UK operations, improved 28% when compared to the same six-month period in 2020. Additionally, its year-to-date Retail revenue, driven primarily by demand for spray gun type tools and accessories, as well as other DIY pneumatic tools and accessories, improved by 29.1%. Further, its Industrial revenue also encountered growth, which we believe is driven primarily by certain sectors beginning to recover from the effects of the pandemic during 2020. As discussed above, the on-going weakness in Jiffy’s aviation customer base continues to result in lower revenue. We do believe however, that this trend should ease and slowly reverse.
Hy-Tech
Hy-Tech designs, manufactures, and sells a wide range of industrial products under the brands ATP and ATSCO which are categorized as ATP for reporting purposes. In addition to Engineered Solutions, products and components manufactured for other companies under their brands are included in the OEM category in the table below. PTG revenue is comprised of products manufactured and sold by Hy-tech’s gear business. NUMATX, Thaxton and other peripheral product lines, such as general machining, are reported as Other.
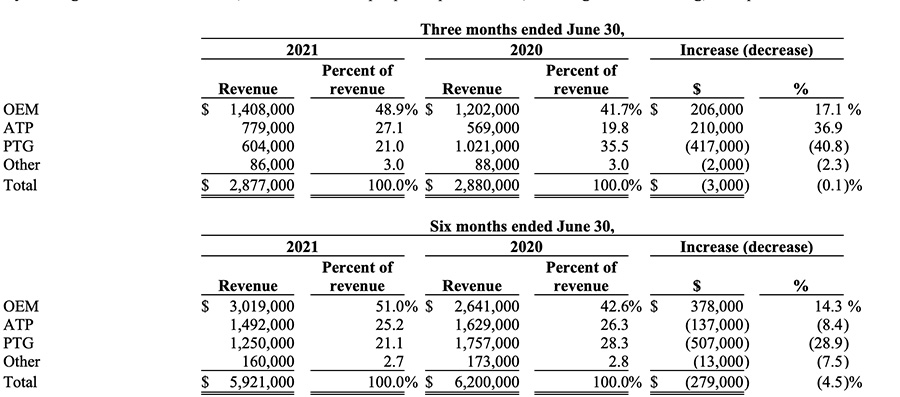
During the second quarter of 2021, Hy-Tech began to encounter modest signs that the ill effects of the pandemic may be beginning to ease. Customer orders for its OEM and ATP product lines improved when compared to the same three-month period a year ago, resulting in revenue growth of 17.1% and 36.9%, respectively. Its Engineered Solutions approach continues to gain momentum, which is driving its OEM revenue growth. ATP revenue improvement was due in large part to a rebound in the pneumatic tool rental sector, and a slight increase in the number of oil and gas rigs. According to Baker Hughes Inc., the average number of oil and gas rotary rigs in operation during the fiscal second quarter 2021 were 453, compared to 392 during the same three-month period in 2020. Additionally, in an effort to increase market penetration, Hy-Tech has “refreshed” and or improved a number of its ATP tools, as well as began to market a new line of large impact wrenches. Hy-Tech believes that the Magnum Force line, its new series of super duty industrial impact tools, that are designed specifically for use in demanding environments, such as refinery turnarounds, power generation outages, structural steel erection, mining and other similar bolting applications, is gaining acceptance. The above increases were offset by a quarter over quarter decline in its PTG revenue. It should be noted that the backlog entering the second quarter of 2020 was much greater than that entering the second quarter of 2021, which was prior to the pandemic. Additionally, PTG encountered delays and disruptions in its supply channel during the second quarter of 2021.
The decline in Hy-Tech’s total revenue for the six-month period ended June 30, 2021, compared to the same period in 2020, was primarily due to the following key factors: i) the ongoing negative effects on the U.S. economy caused by the global COVID-19 pandemic, particularly adversely affecting PTG revenue and operations; and ii) supply chain interruptions from both domestic and international suppliers. When comparing the six-month periods ended June 30, 2021, and 2020, ATP revenue decreased by 8.4%. We believe the second quarter results discussed earlier is more reflective of the business. We are beginning to see improvement in the number and size of ATP orders and are optimistic about market acceptance of our Magnum Force line. OEM revenue increased 14.3% during the six-month period ended June 30, 2021, compared to the same period in 2020, due primarily to the year over year growth in its Engineered Solutions marketing campaign. PTG’s six-month 2021 revenue declined 28.9%, due primarily to the factors discussed earlier. As travel restriction ease and customers begin to accept visitors, we believe order levels should improve. In addition, we are working with vendors and improving internal systems toward the goal of greatly reducing supply chain issues moving forward.
GROSS MARGIN/PROFIT
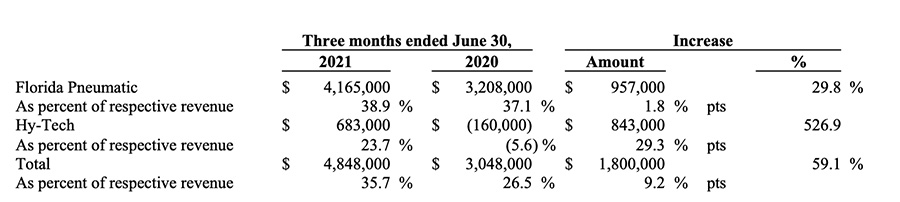
The slight improvement in Florida Pneumatic’s gross margin was due primarily to product mix. The improved Industrial and Automotive revenue this quarter, compared to the same three-month period in 2020, contributed to its overall increase in gross margin. This improvement was partially offset by reduced manufacturing at Jiffy, which in turn resulted in under absorption of its manufacturing overhead. While Hy-Tech’s overall product/customer mix is a key factor in its overall gross margin, it should be noted that Hy-Tech’s second quarter gross margin of 23.7% reflects a 29.3 percentage point improvement, when compared to the same three-month period in 2020. This increase was driven by a slight improvement in its manufacturing overhead absorption. Additionally, during the second quarter of 2020, Hy-Tech recorded an additional charge to its obsolete, slow moving inventory (“OSMI”), and recorded a physical inventory adjustment, whereas no additional charges were incurred during the three-month period ended June 30, 2021.
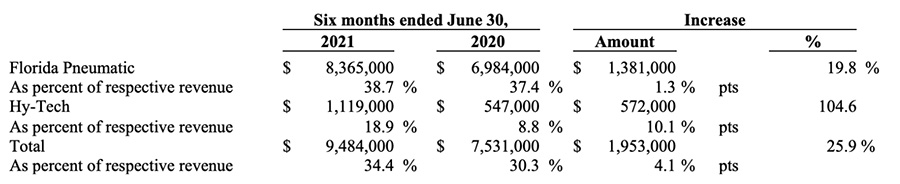
Generally, customer and product mix greatly affect Florida Pneumatic’s gross margin. As discussed earlier, the increase in Florida Pneumatic’s higher margin Industrial and, to lesser degree, its Automotive sales, contributed to the higher gross margin this quarter compared to the same six-month period in 2020. This improvement was partially offset by under absorption of Jiffy’s manufacturing overhead, due to the reduction of product being produced. As Hy-Tech’s nearly manufactures all of its products, its gross margin will be impacted not only by customer/product mix, but also by, among other factors, absorption of manufacturing overhead, raw material pricing and third-party costs. Additionally, Hy-Tech’s OSMI can fluctuate more easily than Florida Pneumatic’s. That said, Hy-Tech’s gross margin for the six months ended June 30, 2021, was 18.9%, which reflects a 10.1 percentage point increase over the same period in the prior year. As discussed above, during the six-month period ended June 30, 2020, Hy-Tech recorded additional charges to its OSMI allowance and an adjustment to its physical inventory, both adversely affecting its 2020 gross margin, whereas there were no additional charges incurred during the six months ended June 30, 2021.
SELLING, GENERAL AND ADMINISTRATIVE EXPENSES
Selling, general and administrative expenses (“SG&A”) include salaries and related costs, commissions, travel, administrative facilities costs, communications costs and promotional expenses for our direct sales and marketing staff, administrative and executive salaries and related benefits, legal, accounting, and other professional fees as well as general corporate overhead and certain engineering expenses.
During the second quarter of 2021, our SG&A increased to $5,458,000, from $4,620,000 incurred during the same three-month period in 2020. There were three major factors causing the increase. First, there was an increase in variable expenses of $421,000, driven by improved revenue this quarter in certain sectors, compared to revenue in the same three-month period in the prior year. Variable expenses include among other things, commissions, freight out, travel, advertising, shipping supplies and warranty costs. The unusually high variable costs this quarter were also driven by significant increases in both ocean and ground freight, where in some instances freight costs have more than doubled. Second, we incurred approximately $288,000 in costs related to the May 2021 ransomware attack at our Florida Pneumatic subsidiary. Additionally, compensation expenses increased $204,000. Compensation expense is comprised of base salaries and wages, accrued performance-based bonus incentives and associated payroll taxes and employee benefits. Partially offsetting the above increases, our expenses related to professional fees, general corporate expenses and depreciation and amortization costs declined in the aggregate $119,000.
Our SG&A expenses for the six-month period ended June 30, 2021, were $10,449,000, compared to $10,310,000, during the same six-month period in 2020. The most significant factors contributing to the net change were i) a reduction of professional fees of $545,000, which was driven by expenses in 2020 related to the relocation and set up the two gear businesses that were acquired in late 2019, none of which reoccurring in 2021, ii) as discussed above, we incurred approximately $288,000 in costs related to the May 2021 ransomware attack at our Florida Pneumatic subsidiary, and iii) driven by an increase of more than $2,600,000 in revenue, our variable expenses, which again include among other items, commissions, freight out, travel, advertising, shipping supplies and warranty costs, increased $570,000. Significant increases in both ocean and ground freight, where, in certain instances, freight costs have more than doubled, is a significant factor to the unusually large increase in the variable expense. Additionally, our compensation expenses declined $92,000. Compensation expense is comprised of base salaries and wages, accrued performance-based bonus incentives and associated payroll taxes and employee benefits. Lastly, when comparing the six-month periods ended June 30, 2021, and 2020, depreciation and amortization expenses declined $74,000.
OTHER INCOME
On April 20, 2020, we received a Paycheck Protection Program (“PPP”) loan, in the amount of $2,929,000. Under the terms of the CARES Act, as amended, we were eligible to apply for forgiveness for all or a portion of the PPP loan. In February 2021, we filed an application for forgiveness with the lender, who approved this submission and submitted the application for forgiveness to the SBA. On June 9, 2021, we were advised that the SBA had approved our PPP loan forgiveness application and as such, the PPP loan and interest were forgiven in its entirety. Accordingly, the lender applied the funds and paid off PPP loan principal in its entirety and interest in full. In accordance with current accounting guidance this forgiveness of debt and related accrued interest is to be accounted for as Other Income and shall not be considerable as taxable income.
INTEREST
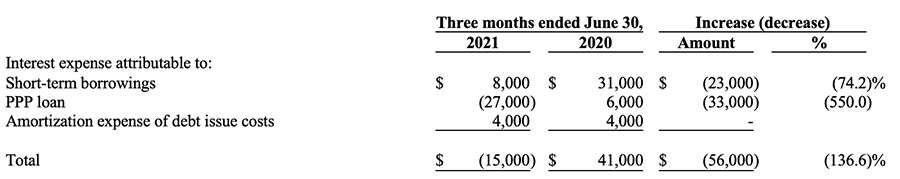
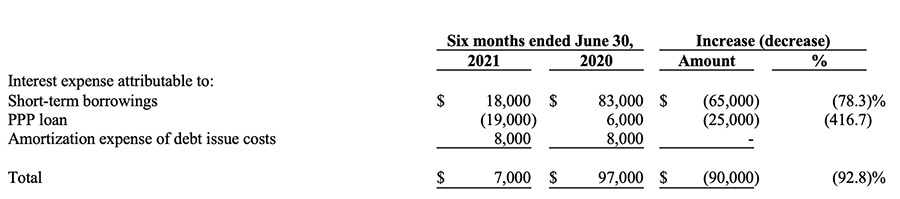
The Applicable Margin, as defined in our Credit Agreement was the same during the three-month periods ended June 30, 2021, and 2020. The average balance of short-term borrowings during the three-month periods ended June 30, 2021, and 2020, were $1,921,000 and $5,347,000, respectively. As the average balance of our short-term borrowings was significantly lower during the first three months of 2021, compared to the same three-month period in 2020, our short-term interest expense (revolver borrowings) declined.
In late April 2020, we borrowed approximately $2.9 million from BNB Bank as provided under the Coronavirus Aid, Relief and Economic Security (“CARES”) Act. This PPP Loan, accrued interest at a rate of 1.0% per annum. Pursuant to the Flexibility Act, interest on any unforgiven amount is deferred until the forgiveness determination is made by the SBA. On June 9, 2021, we received notice that the SBA had forgiven our obligation to repay the PPP loan and related accrued interest. As such, we recorded a reversal of the accrued interest related to the PPP loan.
Lastly, we and our bank amended the Credit Agreement in February 2019. The debt issue costs are associated with such amendment.
INCOME TAXES
At the end of each interim reporting period, we compute an effective tax rate based upon our estimated full year results. This estimate is used to determine the income tax provision or benefit on a year-to-date basis and may change in subsequent interim periods. Accordingly, our effective tax rate for the three-month and six-month periods ended June 30, 2021, was a tax benefit of 3.8% and 8.1%, compared to a tax benefit of 25.5% and 29.6% for the same periods in the prior year. The effective tax rates for all periods presented were impacted primarily by state taxes, and non-deductible expenses. Additionally, for the three- and six-month period ended June 30, 2021, the gain resulting from the forgiveness of debt of the PPP loan was not included in the computation of the effective tax rate.
On March 11, 2021, the American Rescue Plan Act of 2021 (the “APRA”) was signed into law in the U.S. to provide relief as a result of the COVID-19 pandemic. As of June 30, 2021, the Company has determined that the APRA had no significant impact on the Company’s effective tax rate. On March 27, 2020, the CARES Act was signed into law. The CARES Act includes provisions relating to refundable payroll tax credits, deferment of the employer portion of certain payroll taxes, net operating loss carryback periods, alternative minimum tax credit refunds, modifications to the net interest deduction limitation and technical corrections to tax depreciation methods for qualified improvement property.
LIQUIDITY AND CAPITAL RESOURCES
We monitor such metrics as days’ sales outstanding, inventory requirements, inventory turns, estimated future purchasing requirements and capital expenditures to project liquidity needs, as well as evaluate return on assets. Our primary sources of funds are operating cash flows, existing working capital and our Revolver Loan (“Revolver”) with our Bank.
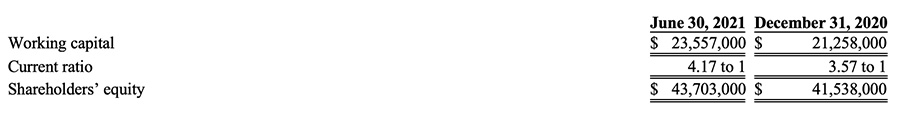
We gauge our liquidity and financial stability by various measurements, some of which are shown in the following table:
Credit facility
Our Credit Facility will be discussed in our upcoming filing of our Form 10-Q for the there-month period ended June 30, 2021.
Cash flows
During the six-month period ended June 30, 2021, our net cash increased to $1,017,000 from $904,000 on December 31, 2020. Our total bank debt at June 30, 2021, was $370,000 compared to $4,303,000 at December 31, 2020, included borrowings under the CARES Act. The total debt to total book capitalization (total debt divided by total debt plus equity) at June 30, 2021, was 0.8% compared to 9.4% at December 31, 2020.
At June 30, 2021, our short-term or Revolver borrowing was $370,000 compared to $1,374,000, at December 31, 2020. Additionally, at June 30, 2021, and December 31, 2020, there was approximately $13,627,000 and $11,971,000, respectively, available to us under the Revolver arrangement.
During the six-month period ended June 30, 2021, we used $247,000 for capital expenditures, compared to $915,000 during the same period in the prior year. Capital expenditures for the balance of 2021 is expected to be approximately $750,000, some of which may be financed through our credit facilities with Capital One Bank or financed through independent third-party financial institutions. The remaining 2021 capital expenditures will likely be for machinery and equipment, tooling, and computer hardware and software.
ABOUT P&F INDUSTRIES, INC.
P&F Industries, Inc., through its wholly owned subsidiaries, is a leading manufacturer and importer of air-powered tools and accessories sold principally to the aerospace, industrial, automotive, and retail markets. P&F’s products are sold under its own trademarks, as well as under the private labels of major manufacturers and retailers.
OTHER INFORMATION
P&F Industries Inc. has scheduled a conference call later today at 11:00 A.M. Eastern Time, to discuss its second quarter 2021 results and financial condition. Investors and other interested parties who wish to listen to or participate can dial 1-800-367-2403. It is suggested you call at least 10 minutes prior to the call commencement. For those who cannot listen to the live broadcast, a replay of the call will also be available on the Company’s website beginning on or about August 13, 2021.
Forward Looking Statement
The Private Securities Litigation Reform Act of 1995 (the “Reform Act”) provides a safe harbor for forward-looking statements made by or on behalf of P&F Industries, Inc. and subsidiaries (“P&F”, or the “Company”). P&F and its representatives may, from time-to-time, make written or verbal forward-looking statements, including statements contained in the Company’s filings with the Securities and Exchange Commission and in its reports to shareholders. Generally, the inclusion of the words “believe,” “expect,” “intend,” “estimate,” “anticipate,” “will,” “may,” “would,” “could,” “should,” and their opposites and similar expressions identify statements that constitute “forward-looking statements” within the meaning of Section 27A of the Securities Act of 1933 and Section 21E of the Securities Exchange Act of 1934 and that are intended to come within the safe harbor protection provided by those sections. Any forward-looking statements contained herein, including those related to the Company’s future performance, are based upon the Company’s historical performance and on current plans, estimates and expectations. All forward-looking statements involve risks and uncertainties. These risks and uncertainties could cause the Company’s actual results for all or part the 2021 fiscal year and beyond to differ materially from those expressed in any forward-looking statement made by or on behalf of the Company for a number of reasons including, but not limited to:
- Risks related to the global outbreak of COVID-19 and other public health crises;
- Risks associated with sourcing from overseas;
- Disruption in the global capital and credit markets;
- Importation delays;
- Customer concentration;
- Unforeseen inventory adjustments or changes in purchasing patterns;
- Market acceptance of products;
- Competition;
- Price reductions;
- Exposure to fluctuations in energy prices;
- The strength of the retail economy in the United States and abroad;
- Risks associated with Brexit;
- Adverse changes in currency exchange rates;
- Interest rates;
- Debt and debt service requirements;
- Borrowing and compliance with covenants under our credit facility;
- Impairment of long-lived assets and goodwill;
- Retention of key personnel;
- Acquisition of businesses;
- Regulatory environment;
- Litigation and insurance;
- The threat of terrorism and related political instability and economic uncertainty; and
- Business disruptions or other costs associated with information technology, cyber-attacks, system implementations, data privacy or catastrophic losses,
and those other risks and uncertainties described in its Annual Report on Form 10-K for the year ended December 31, 2020, its Quarterly Reports on Form 10-Q, and its other reports and statements filed by the Company with the Securities and Exchange Commission. Forward-looking statements speak only as of the date on which they are made. The Company undertakes no obligation to update publicly or revise any forward-looking statement, whether as a result of new information, future developments or otherwise. The Company cautions you against relying on any of these forward-looking statements.
CONSOLIDATED BALANCE SHEET (PDF)
P&F Industires, Inc. make available forms & documents which are available for download. These forms & documents are in Adobe® PDF (portable document file) format. In order to view these forms & documents, you must have Adobe® Acrobat® 7 Reader. If you don't have the reader, you can download it for free from Adobe® by clicking here or on the "Get Acrobat® Reader" icon below.
![]()