News
2023 Press releases
P&F Industries, Inc.
Joseph A. Molino, Jr.
Chief Operating Officer
631-694-9800
www.pfina.com
Joseph A. Molino, Jr.
Chief Operating Officer
631-694-9800
www.pfina.com
P&F INDUSTRIES, INC. REPORTS RESULTS FOR THE THREE AND NINE-MONTH PERIODS ENDED SEPTEMBER 30, 2023
MELVILLE, N.Y., November 9, 2023 - P&F Industries, Inc. (NASDAQ: PFIN) today announced its results from operations for the three and nine-month periods ended September 30, 2023. The Company is reporting net revenue of $14,404,000 and $46,309,000, respectively, for the three and nine-month periods ended September 30, 2023, compared to $14,516,000 and $46,347,000, respectively, for same periods in 2022. For the three-month period ended September 30, 2023, the Company is reporting a net loss before income taxes of $979,000, compared to a net loss before income taxes of $346,000, for the three-month period ended September 30, 2022. For the nine-month period ended September 30, 2023, the Company is reporting a net loss before income taxes of $128,000, compared to a net loss before income taxes of $1,005,000 for the nine-month period ended September 30, 2022. For the three-and ninemonth periods ended September 30, 2023, the Company is reporting a net loss after taxes of $721,000 and $146,000, respectively, compared to net losses after taxes of $237,000 and $876,000, respectively, for the same periods in 2022. The Company’s basic and diluted loss per share for the three and nine-month periods ended September 30, 2023, were $0.23 and $0.05, respectively, compared to basic and diluted loss per share of $0.08 and $0.28, respectively, for the same three and nine-month periods in 2022.
The Company noted that, during the three and nine-month periods ended September 30, 2023. it incurred approximately $515,000 and $729,000, respectively, of professional fees in connection with it entering into an agreement and plan of merger, which was announced on October 13, 2023. These expenses were a significant factor that contributed to the net losses for such periods.
As was previously announced, the Company decided not to hold an earnings call that it normally would hold on the day of an earnings release, in light of the recent announcement that it has entered into the agreement and plan of merger mentioned above.
The Company will be reporting the following:
RESULTS OF OPERATIONS
REVENUE
The tables below provide an analysis of our net revenue for the three-month periods ended September 30, 2023, and 2022:
Consolidated
Florida Pneumatic
Florida Pneumatic markets its air tool products to four primary sectors within the pneumatic tool market; Automotive, Retail, Aerospace and Industrial. It also generates revenue from its Berkley products line, as well as a line of air filters and other OEM parts (“Other”).
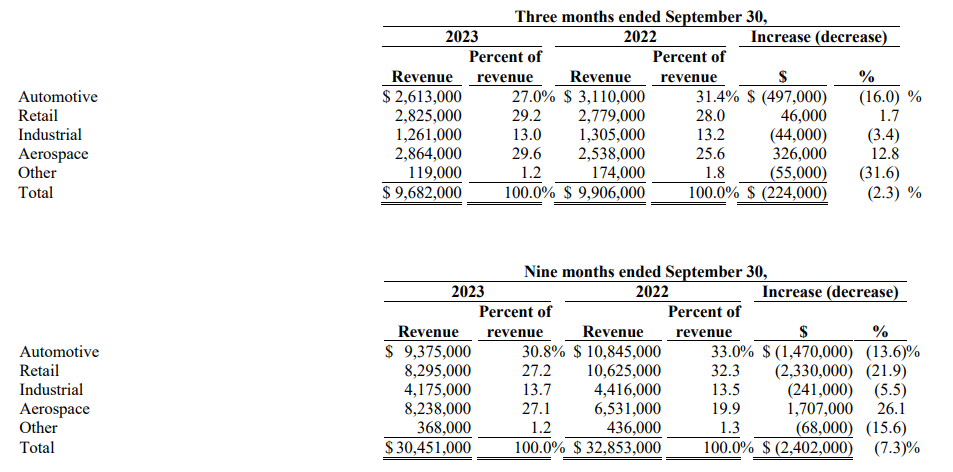
Automotive revenue declined this quarter, compared to the same period in 2022, due primarily to an across-the-board price increase in all distribution channels in order to address rising input costs. This change in pricing strategy led to a decline in the number of unit sales and thus overall revenue in this category. However, Automotive gross margin improved as a result of this change. Florida Pneumatic’s third quarter 2023 Retail revenue improved a modest 1.7%, when compared to the same period in the prior year, despite The Home Depot’s continued efforts that began earlier this year of reducing the number of individual stock keeping units offered, as well as the quantity of each, and reducing the display area of their pneumatic tools. We believe that THD is facing increased pressure from on-line distributors, as well as other “brick and mortar” retailers that are expanding their presence in this product line. Aerospace revenue improved 12.8% when comparing the third quarter of 2023 to the same period in 2022. This improvement was driven by, among other factors, increased demand for new consumable parts, that Jiffy had begun to market earlier this year, and improved market conditions in both the commercial and military aviation. In addition, Jiffy has increased its sales in Europe significantly and is also seeing initial sales of recently introduced products. Lastly, the slight decline in Industrial revenue was due primarily to supply chain issues and by economic uncertainty in the sector.
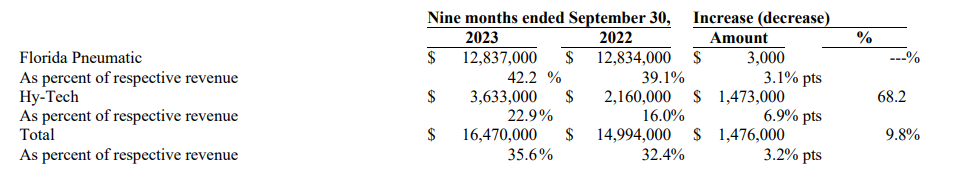
Florida Pneumatic’s nine-month revenue analysis is quite similar to that of its third quarter 2023 results. When compared to the nine-month period ended September 30, 2022, Florida Pneumatic’s third quarter 2023 Automotive revenue declined due primarily to our revised pricing and marketing changes put into effect mid-2022. However, as will be discussed later in this discussion and analysis, this change contributed to an overall improvement in Florida Pneumatic’s gross margin. The significant factors causing the decline in our Retail revenue for the nine-month periods ended September 30, 2023, compared to the same period in 2022 was the product rollout that occurred in the second quarter of 2022 with no such event occurring during 2023. This year-over-year decline was also driven by THD’s decision to lower its inventory of floor display space this year. During the nine-month period ended September 30, 2023, Aerospace revenue increased 26.1%, when compared to the same period in the prior year. The improvement was driven by resurgence in both the commercial and military components of the Aerospace sector, and increased demand for the new, consumable parts that Jiffy has begun to market. In addition, Jiffy has increased its sales in Europe and is also seeing initial sales of recently introduced products.
Hy-Tech
Hy-Tech designs, manufactures, and sells a wide range of industrial products which are categorized as ATP for reporting purposes. In addition to Engineered Solutions, products and components manufactured for other companies under their brands are included in the OEM category in the table below. PTG revenue is comprised of products manufactured and sold by Hy-Tech’s gear business. NUMATX, Thaxton and other peripheral product lines, such as general machining, are reported as Other.
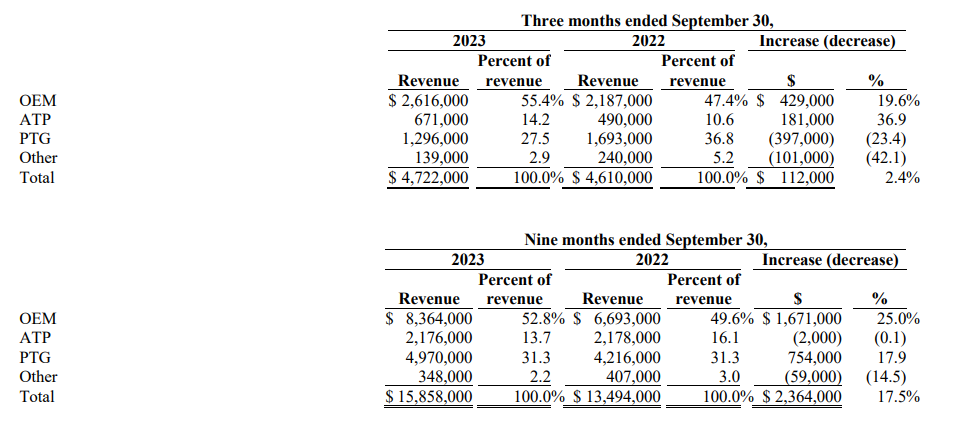
The net improvement in Hy-Tech’s revenue this quarter, compared to the same three-month period in 2022, was driven by the 19.6% growth of OEM revenue. It should be noted that Hy-Tech’s revenue by product line fluctuates throughout the year. This fluctuation is caused by, among other factors, timing of orders, production scheduling and reliance on outside vendors and suppliers. The improvement this quarter, compared to the same period in 2022 is due primarily to an increase in orders during 2023, from a major OEM customer, along with an overall market improvement in this sector. The 36.9% increase in Hy-Tech’s ATP revenue is primarily due to weak third quarter 2022 orders and shipments. The above increases were partially offset by a decline in PTG revenue. This decline was due to i) product/customer mix, ii) the implementation of new planning and production processes and procedures, which in turn caused delays in the manufacturing process, iii) associated training related thereto, and iv) delays in receipt of product being returned from third-party vendors. The decline in Hy-Tech’s Other revenue, which is driven by general machining, was due to Hy-Tech’s decision to focus on OEM and ATP product lines. Thaxton revenue was softer this quarter, compared to the same three-month period in 2022.
The 17.5% year-over-year increase in Hy-Tech’s total revenue was primarily driven by its ongoing growth in OEM and to a lesser degree PTG revenue. The increase in OEM revenue was driven by growth in certain markets that are served by a number of HyTech’s OEM customers. The markets served by our customers include multiple industrial applications, as well as the tool rental market. PTG revenue for the nine-month period ended September 30, 2023, increased 17.9% when compared to the same period in the prior year. This improvement was driven by the acquisition of the Jackson Gear Company business in January 2022. The decrease in HyTech’s Other revenue as discussed above, was due to weaker NUMATX and general machining revenue during the third quarter 2023. The modest year to date decline in ATP revenue is attributable to our decision to focus our marketing efforts on OEM and PTG product
GROSS MARGIN/PROFIT
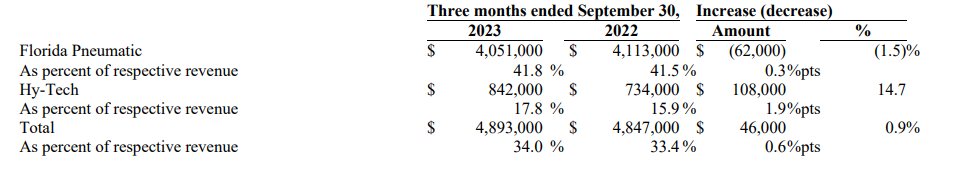
Florida Pneumatic’s gross margin for the three-month period ended September 30, 2023, improved by 0.3 percentage points compared to the same period in the prior year principally due to a shift away from their lower margin Retail and Automotive product lines to the higher margin, Industrial and Aerospace categories. During the third quarter of 2023 Hy-Tech’s gross margin increased 1.9 percentage points, when compared to the same period in 2022. This improvement was due primarily to product/customer mix. Hy-Tech continued to pursue cost and expense reductions, and coupled with revisions in pricing structure, it has been able to improve its blended gross margin, thus contributing to the overall gross margin improvement. Partially offsetting the above improvements, during the third quarter Hy-Tech recorded an additional charge to its Obsolete and Slow-Moving Inventory of $80,000. Lastly, during the third quarter of 2023, Hy-Tech’s PTG product line’s gross margin was negatively affected due primarily to the implementation of new planning and production procedures and processes and delays caused by outside vendors, both of which negatively impacted its overhead absorption.
Florida Pneumatic’s gross margin for the nine-month period ended September 30, 2023, improved compared to the same period in the prior year principally due to a shift away from their lower margin product lines to the higher margin categories. Further, during the latter half of 2022, we raised prices in all product categories, which contributed to the improved gross margin. This change in marketing strategy and pricing adjustments led to a 3.1 percentage point year-to-date improvement over the same period in the prior year.
The improvement in Hy-Tech’s nine-month gross margin is due primarily to product/customer mix. Further, during the ninemonth period ended September 30, 2023, Hy-Tech was able to reduce manufacturing costs and expenses, primarily at its Cranberry PA facility. Also as noted above, beginning in 2022, Hy-Tech modified its pricing structure, which effectively improved its overall gross margin. Hy-Tech continues to focus on improving manufacturing overhead absorption, particularly at its PTG facility in Punxsutawney PA.
SELLING, GENERAL AND ADMINISTRATIVE EXPENSES
Selling, general and administrative expenses (“SG&A”) include salaries and related costs, commissions, travel, administrative facilities costs, communications costs and promotional expenses for our direct sales and marketing staff, administrative and executive salaries and related benefits, legal, accounting, and other professional fees as well as general corporate overhead and certain engineering expenses.
During the third quarter of 2023, our SG&A was $5,785,000 compared to $5,084,000 incurred during the same three-month period in 2022. Significant components to the net increase include: • Compensation expenses increased $215,000. Com
- • Compensation expenses increased $215,000. Compensation expenses are comprised of base salaries and wages, accrued performance-based bonus incentives and associated payroll taxes and employee benefits.
- • Professional fees and expenses (i.e., accounting, legal, consulting, etc.) increased $471,000 primarily due to $515,000 of legal and consulting costs incurred in connection to the transaction announced on October 13, 2023.
- • Expenses of $110,000 incurred in connection with the relocation of Florida Pneumatic’s warehouse and administrative offices.
- • Variable expenses declined $58,000. Variable expenses include among other items, commissions, freight out, travel, advertising, shipping supplies and warranty costs.
- • A reduction in bank fees of $30,000.
Our SG&A for the nine-month period ended September 30, 2023, was $16,327,000, compared to $15,736,000 for the same nine-month period in the prior year. Key components of this net increase include:
- • Increased compensation expenses of $327,000.
- • Professional fees and expenses increased $571,000 primarily due to $729,000 of legal and consulting costs incurred in connection to the transaction announced on October 13, 2023.
- • Expenses of $110,000 incurred in connection with the relocation of Florida Pneumatic’s warehouse and administrative offices.
- • Variable expenses declined $368,000 Driving this decline was lower advertising and shipping costs at Florida Pneumatic, caused primarily by lower Retail revenue this quarter and a reduction in discretionary Automotive advertising expenses, compared to the same period a year ago.
- • Stock-based compensation and bank fees declined $39,000 and $40,000, respectively.
OTHER EXPENSE (INCOME) – net
During the three-month period ended September 30, 2023, we recognized a gain on sale of equipment of $23,000.
During the nine-month period ended September 30, 2023, Other Income included the gain on sale of equipment during the current quarter discussed above. Additionally, during the second quarter of 2023 we incurred a loss of $9,000, and a gain of $5,000 on transactions involving the sale of equipment. During the three-month period ended March 31, 2023, we recognized a gain of $21,000 from the sale of equipment. Lastly, as a result of the final resolution of our Employee Retention Tax Credit (“ERTC”) filings, we recorded an additional $15,000 as Other Income. The ERTC income is subject to federal and local tax
INTEREST – NET
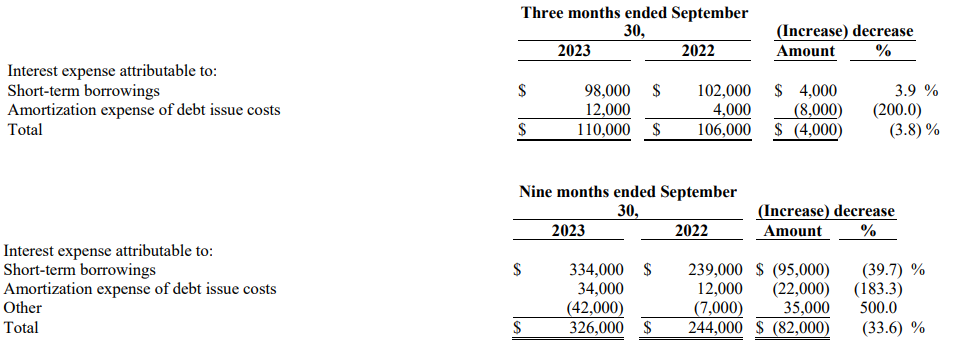
Most of our borrowings are Secured Overnight Financing Rate, (“SOFR”) plus Applicable Margin. The Applicable Margin, as defined in our Credit Agreement, during the three-month period ended September 30, 2023, was 2.10% applied to all SOFR borrowings and 1.10% applied to Base Rate (Prime Rate) borrowings. The Applicable Margins that were added to SOFR and Base Rate borrowings during the three-month period ended September 30, 2022, were 1.50% and 0.50%, respectively. During the three-month period ended September 30, 2023, SOFR ranged from 7.17% to 7.44%, compared to 3.15% to 4.91% during the third quarter of 2022. The Base Rate during the three-month period ended September 30, 2023, ranged from 8.25% to 8.50%, compared to a range of 4.75% to 6.25%, during the same period a year ago.
The average balance of short-term borrowings during the three and nine-month periods ended September 30, 2023, were $4,439,000, and $6,252,000, respectively, compared to $9,499,000 and $10,403,000, for the same periods in the prior year.
In late March 2023, we and the Bank amended the Credit Agreement, and as a result, we wrote off the balance of the unamortized debt issue cost as of the date of Amendment No.11 during the first quarter of 2023. The Debt issue costs incurred in connection with the above-referenced Amendment No.11, are being amortized through the expiration date of credit Agreement, which is February 2027.
Other interest refers to interest or adjustments to ERTC refunds. Other interest during the nine-month period in the prior year was interest income recorded in connection with Federal income tax refunds received during the second quarter of 2022
INCOME TAXES
At the end of each interim reporting period, we compute an effective tax rate based upon our estimated full year results. This estimate is used to determine the income tax provision or benefit on a year-to-date basis and may change in subsequent interim periods. Accordingly, the effective tax rate for the three and nine-month periods ended September 30, 2023, were approximately 26.3% and 14.1%, respectively, and for the same periods in 2022, the effective tax rates were an income tax benefit of 31.5%, and 12.8%, respectively. The effective tax rates for all periods presented were impacted primarily by state taxes and non-deductible expenses.
LIQUIDITY AND CAPITAL RESOURCES
We monitor such metrics as days’ sales outstanding, inventory requirements, inventory turns, estimated future purchasing requirements and capital expenditures to project liquidity needs, as well as evaluate return on assets. Our primary source of funds is our Revolver loan with our bank.
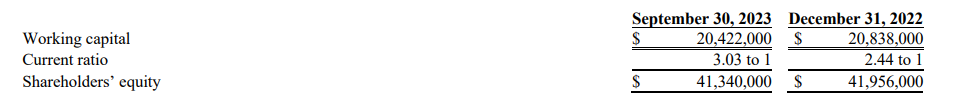
We gauge our liquidity and financial stability by various measurements, some of which are shown in the following table:
Credit Agreement
As discussed above, we and the Bank entered into an amendment to the Credit Facility that, among other things, extended the expiration date to February 8, 2027.
At September 30, 2023, there was approximately $10,580,000 available to us under the Revolver arrangement.
Cash Flows
Flows For the nine-month period ended September 30, 2023, cash provided by operating activities was $7,061,000, compared to cash provided in operating activities for the nine-month period ended September 30, 2022, of $1,305,000. At September 30, 2023, and December 31, 2022, our consolidated cash balance was $338,000, and $667,000, respectively. We operate under the terms and conditions of the Credit Agreement. As a result, all domestic cash receipts are remitted to Capital One lockboxes. Thus, nearly all cash on hand represents funds to cover checks issued but not yet presented for payment.
Our total debt to total book capitalization (total debt divided by total debt plus equity) at September 30, 2023, was 6.1%, compared to 15.3% at December 31, 2022.
During the nine-month period ended September 30, 2023, we used $1,909,000 for capital expenditures, compared to $1,222,000 during the same period in the prior year. Capital expenditures currently planned for the remainder of 2023 are approximately $600,000, which we expect will be financed through the Credit Facility.
The major portion of these planned capital expenditures will be for new metal cutting equipment, tooling and information technology hardware and software.
Our liquidity and capital are primarily sourced from the Credit Agreement, described in Note 8 – Debt, to our consolidated financial statements, and cash from operations.
Should the need arise whereby the current Credit Agreement is insufficient, we believe we could obtain additional funds based on the value of our real property and believe the borrowing under the current Agreement could be increased.
ABOUT P&F INDUSTRIES, INC.
P&F Industries, Inc., through its wholly owned subsidiaries, is a leading manufacturer and importer of air-powered tools and accessories sold principally to the aerospace, industrial, automotive, and retail markets. P&F’s products are sold under its own trademarks, as well as under the private labels of major manufacturers and retailers.
Forward Looking Statement
The Private Securities Litigation Reform Act of 1995 (the “Reform Act”) provides a safe harbor for forward-looking statements made by or on behalf of P&F Industries, Inc. and subsidiaries (“P&F”, or the “Company”). P&F and its representatives may, from time-to-time, make written or verbal forward-looking statements, including statements contained in the Company’s filings with the Securities and Exchange Commission and in its reports to shareholders. Generally, the inclusion of the words “believe,” “expect,” “intend,” “estimate,” “anticipate,” “will,” “may,” “would,” “could,” “should,” and their opposites and similar expressions identify statements that constitute “forward-looking statements” within the meaning of Section 27A of the Securities Act of 1933 and Section 21E of the Securities Exchange Act of 1934 and that are intended to come within the safe harbor protection provided by those sections. Any forward-looking statements contained herein, including those related to the Company’s future performance, are based upon the Company’s historical performance and on current plans, estimates and expectations. All forward-looking statements involve risks and uncertainties. These risks and uncertainties could cause the Company’s actual results for all or part the 2023 fiscal year and beyond to differ materially from those expressed in any forward-looking statement made by or on behalf of the Company for a number of reasons including, but not limited to:
- Risks associated with sourcing from overseas;
- Disruption in the global capital and credit markets;
- Importation delays;
- Customer concentration;
- Unforeseen inventory adjustments or changes in purchasing patterns;
- Market acceptance of products;
- Competition;
- Price reductions;
- Exposure to fluctuations in energy prices;
- The strength of the retail economy in the United States and abroad;
- Adverse changes in currency exchange rates;
- Interest rates;
- Debt and debt service requirements;
- Borrowing and compliance with covenants under our credit facility;
- Impairment of long-lived assets and goodwill;
- Retention of key personnel;
- Acquisition of businesses;
- Regulatory environment;
- Litigation and insurance;
- The threat of terrorism and related political instability and economic uncertainty;
- Business disruptions or other costs associated with information technology, cyber-attacks, system implementations, data privacy or catastrophic losses.
and those other risks and uncertainties described in the 2022 Form 10-K, its Quarterly Reports on Form 10-Q, and its other reports and statements filed by the Company with the Securities and Exchange Commission. Forward-looking statements speak only as of the date on which they are made. The Company undertakes no obligation to update publicly or revise any forward-looking statement, whether as a result of new information, future developments or otherwise. The Company cautions you against relying on any of these forward-looking statements.
Forward-looking statements speak only as of the date on which they are made. The Company undertakes no obligation to update publicly or revise any forward-looking statement, whether as a result of new information, future developments or otherwise. The Company cautions you against relying on any of these forward-looking statements.
CONSOLIDATED BALANCE SHEET (PDF)
P&F Industires, Inc. make available forms & documents which are available for download. These forms & documents are in Adobe® PDF (portable document file) format. In order to view these forms & documents, you must have Adobe® Acrobat® 7 Reader. If you don't have the reader, you can download it for free from Adobe® by clicking here or on the "Get Acrobat® Reader" icon below.
![]()